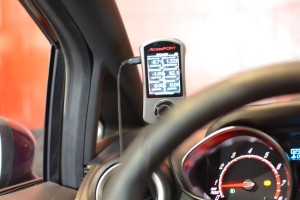
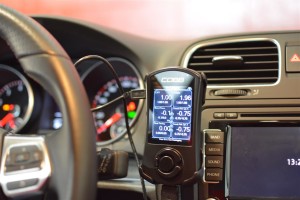
The Cobb AccessPort unleashes a continuous bombardment of information. The screen can be setup to display 6 live engine statistics with each showing min/max figures. This is just the surface; with the touch of a button, it’ll begin recording a variety of parameters of your choosing. That’s a lot of information that was previously inaccessible. What does this mean? What’s will this information tell me? I’m glad you asked!
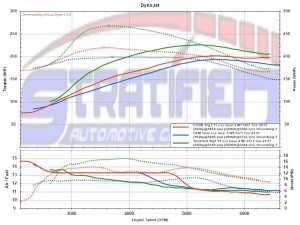
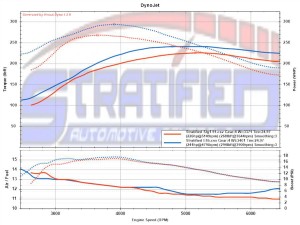
One of the more fun things to do with all this data is to plot your own dyno curves based on full gear pulls! Do you know when your optimal shift points are? Is it worthwhile revving the engine deep into redline? Where could I gain time? When does my turbo really spool? What’s my baseline power? How much power was gained from the last mod or tune? Once you see the power curve, these questions are easily answered!
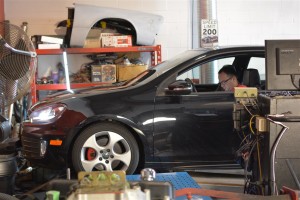
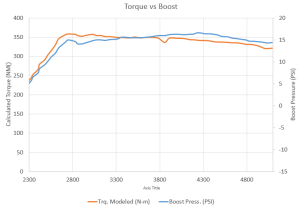
So let’s talk about V-Dyno. Just like an in-ground dynamometer it measures the force (torque) applied by the engine to accelerate your car. Let’s say you go out driving, it’s the middle of boost season, and the car is running like the prized thoroughbred it was built to be. Everything feels good, ear to ear smile, but then, what do you tell your buddies? My butt-dyno says I make 347WHP? They’ll laugh you out of the stable. Instead take a data log. Let V-Dyno crunch the numbers, and have a printout that your car is actually making 347WHP! If the datalogs you take are consistent (as described later in the article) and you setup your car’s parameters correctly, Vdyno can be very accurate and repeatable and we have correlated our results to in-ground dyno data.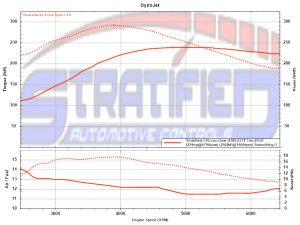
So how does it all work?
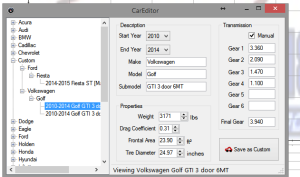
V-dyno analyses engine speed (RPM) and calculates acceleration performance based on the rate of change of engine speed in a single gear. It factors in tire size, weight of the car, gear ratio, ambient air temperature and frontal area of your car and a number of other things such as occupant weight. You’ve probably heard “oh but that was power on such and such dyno so the numbers are skewed this and that way”. Well, that’s also built in. You can select your dyno type and correction factor. There’s a large amount of preset cars in their database but we’ve build a good profile for the VW GTI. You can build the same profile in your own installation of Vdyno using the information below.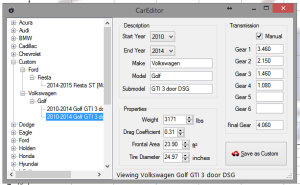
How do I collect data?
First, the AP has to be setup to record all the useful parameters. For Vdyno you need to log at least AFR, Accelerator Pedal Position, Boost Pressure, and RPM. You can log others as well, but these are the ones that are used in the calculation. Then, while driving make sure you are in the Gauges screen. The car will need to be cruising in 3rd or 4th gear, around 2500 rpm. Click the center button to start recording. Wait a second until the screen on the AP starts refreshing again, and then stomp on the gas as if it were an on/off switch. Take it to redline, release the gas pedal, shift up, then click the center button again to stop recording. 
Your final results are only as good as the collected data. Here are a few hints to getting repeatable V-dyno results:
- Make sure it’s not windy
- Keep ambient temperatures consistent
- Always collect data on the same stretch of road
- Empty your trunk
- Don’t take passengers along
- Gas tank half full
- Do 2 or 3 passes
- 4th gear logs are better than 3rd
- Stay safe!!!
I have logs, now what?
Transfer them to your computer using the AccessPort manager. Download Virtual Dyno, and set it up with the correct profile for your car. Match the columns up. Then drag and drop the logs in, wait a second and you’ll see your power curve.
But my power curve looks strange.
There are a number of things that will skew the data and so the end result will be way off. If you see strange humps, bumps, and non smooth curves, chances are that the car lost traction, you had clutch slip, there was a big bump in the road or something else went wrong. If you come up with something odd and want to chat about your setup (and how to get more power) drop us a line!
Happy Vdyno-ing!


