A turbocharger is comprised of a compressor and a turbine linked by a shaft. We won’t go over how a turbo works here but if you’re unsure check out this link put together by Garrett.
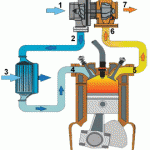
Source: Garrett Website
We all want more power and in the case of running a turbo engine, we want to make sure we recognize the bottlenecks of the particular setup we are running so that we can address them without spending money and effort in the wrong areas. Today’s article will focus on what our wastegate duty cycle (WGDC) and boost curves can tell us about our system. First of all, a quick review of how a wastegate works.
In order to generate boost, exhaust gases must pass through the turbine of the turbo located on the exhaust side and spin it. When the turbine has reached the speed necessary to hold the boost that we want, the wastegate opens to divert extra exhaust gases and maintain the turbo speed we want to generate the boost we desire. The turbo speed needed for a particular boost level depends on many variables including engine size, how well the engine breathes, turbo size, engine speed, temperature, etc. The wastegate is controlled by a spring and diaphragm actuator and that spring determines what we call spring boost pressure. Spring pressure is the least amount of boost we can run in the system without going to a softer spring. To increase the boost beyond spring pressure we must either get a different spring (difficult) or we trick the wastegate into seeing LESS pressure at the diaphragm than what the motor is actually seeing. This is done using an electronic solenoid that switches very fast and runs a particular duty cycle. This is how almost all modern boost control works. The important thing to remember is that 0% wastegate duty cycle (0% WGDC) means the solenoid is not being actuated at all and this results in low boost (spring pressure). When the solenoid is actuated 100% of the time it results in the highest boost the system can run (100% WGDC).
When we want the turbo to spool we run as high WGDC as possible until the turbo spools and then we quickly drop WGDC into a steady state zone without overshooting the boost target. When we want to slow down the turbo we run LESS WGDC and when we want to speed up the turbo we run MORE WGDC.
If you datalog a full single gear sweep and take a look at WGDC and boost for the entire run, you can get some valuable information about your turbo system as a whole.
Below we will examine 3 different setups.
The first is an OEM turbo Focus ST with the OEM wastegate spring (6psi) that is fully bolted. Stock turbos are generally small and therefore you get a quick spool, great midrange, but the turbo can’t keep boost up in the upper engine RPM. As you can see in the graph WGDC is driven to 100% up top and boost still falls off. This means you have peak power and torque early in the rev range but it drops off up top.
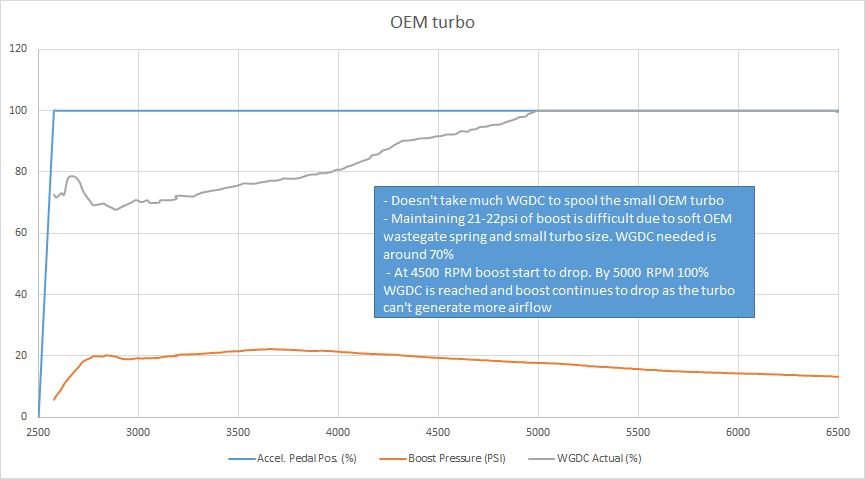
Now, the question is what can we do to improve this setup? The car is already fully bolted with well flowing parts such as a catless exhaust, big intake, and good intercooler. Because of this the attention switches to the turbo itself. The OEM spring in the wastegate is only 6psi and we are driving it to over 21psi. This is quite a strain for a 6psi spring and is part of the reason we see such a dramatic boost drop in the upper RPMs when the engine demands more air. While we can replace the spring with a stiffer one to keep boost up, this is NOT a good idea in this case. The turbo is out of efficiency and riding the far right side of the compressor map called the choke line. (Here’s a primer on reading compressor maps). We know this because we know what the stock compressor can flow and we know what the engine is flowing in the upper RPM at that boost level. Adding more bolt-ons to increase flow will have minimal effects on power.
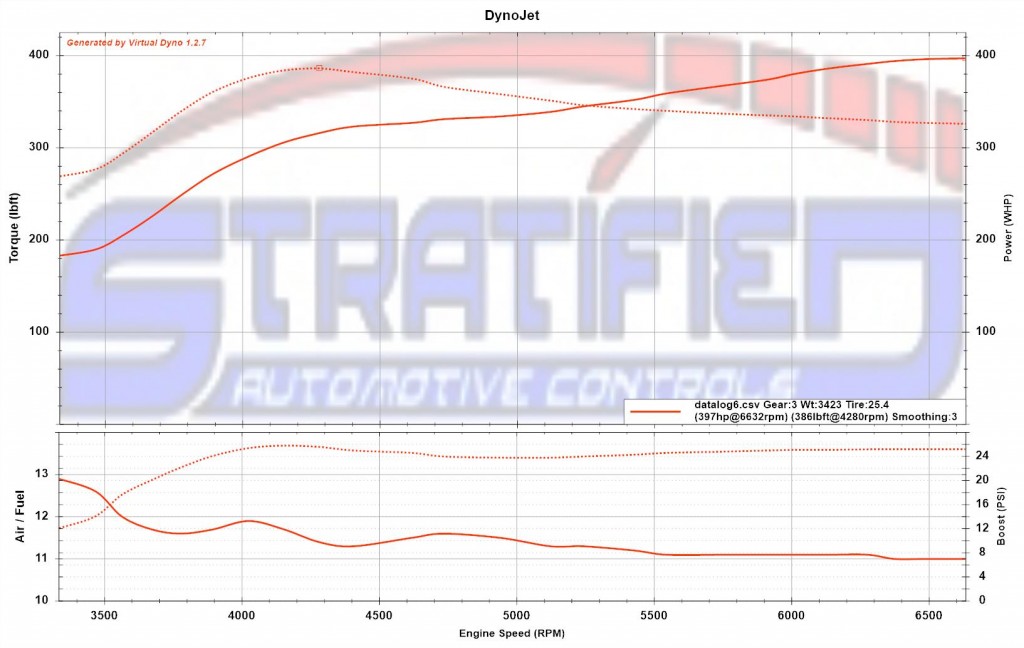
In this case, to improve the top end performance, a larger turbocharger is needed. This trades off the lightning quick response of the OEM turbo for a lot more top end. So now we bolt on a GTX2867 which is an excellent match for the 2.0 Ecoboost. The graph below is a car with full bolt ons, a GTX2867 with a 14psi wastegate spring and high flow catted downpipe. The exhaust is 3″ and it has all the other bolt ons such as an intake and good intercooler.
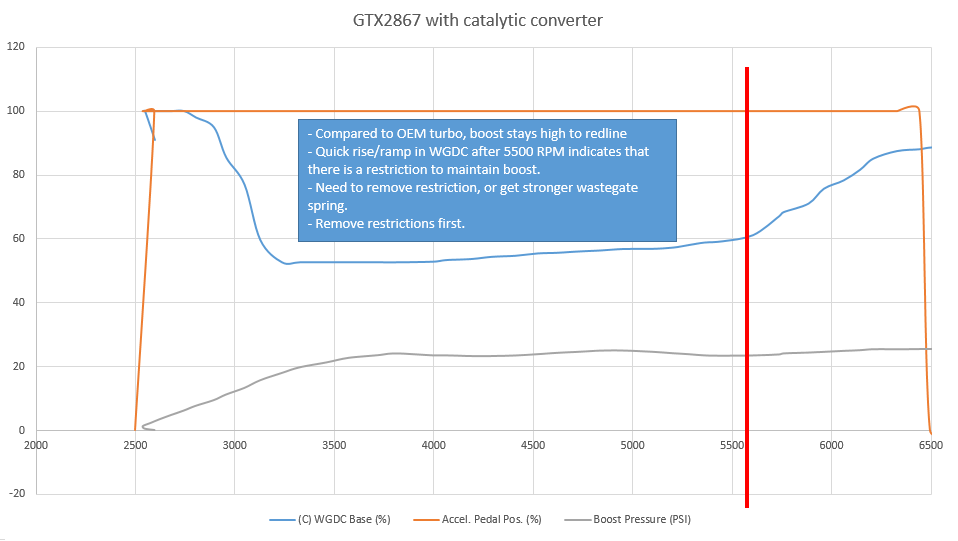 Here things are looking much better. The car is holding 24-25psi to redline, making a lot more power up top and all seems to be well, right? Well, not quite. Again the shape of the wastegate duty cycle (WGDC) shows us that while the system is efficient up to 5500 RPM, there is some sort of restriction beyond that point. The wastegate duty must rise very quickly in order to maintain that boost pressure to redline. Based on the compressor map, we know this turbo is still efficient at this pressure on this engine up to redline. So something else must be causing a restriction. The intake is already free flowing, so we turn our attention to the exhaust side. Here, we have a full 3″ turboback but use a high flow catalytic converter. Controlling boost pressure is very much influenced by exhaust flow and back pressure, so we went ahead and removed the catalytic converter for a race weekend when the car was not driven on the street.
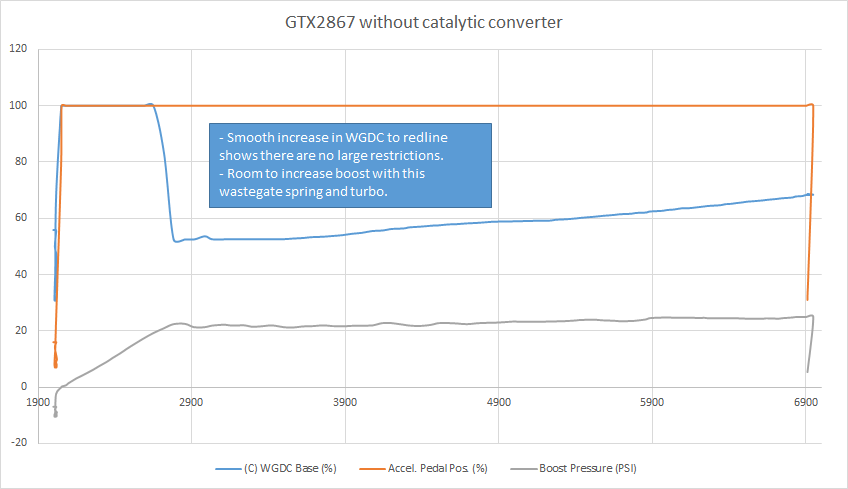
It is now obvious that the the catalytic converter was acting as an exhaust restriction. The WGDC now has a linear rise all the way to redline and we have some headroom should we want to increase the boost further. Of course if we try and push boost and airflow beyond what the GTX2867 can achieve (past 420whp or so) then we will again run into a similar shape and curve to what we saw on the OEM turbo and once again we must look into a larger turbo.
The lesson here is two fold. First, it is important to have a clear goal in mind when building any setup. A big turbo has excellent top end but a smaller turbo has great response and low-end performance.
Secondly, it is important to analyse the data and understand WHICH parts to change to achieve your goals. With the OEM turbo for example a 3″ catback on the Focus ST only yields 5-7whp because it is not a big restriction with the K03 turbo in place. With a GTX2867, a 3″ catback is worth 20-30whp at the 400whp output mark.
The turbo and components should always be matched to the engine, response desired, and overall power and reliability goals. We spend a lot of time analysing data from different setups so if you have a goal in mind and need some information on how to get there, don’t hesitate to get in touch.


